Heatmaps Give You Insights, Reactful Gets You Results
Using heatmaps is a key way for marketers to get real-time analytics for their website. Heatmaps are a data visualization tool that can tell you which areas of your site get the most attention and at what times. They typically show your site analytics in a warm-to-cool color spectrum, which shows you in a quick visual snapshot which areas of your site are the “hottest” (the ones in orange and red, typically). It’s a form of visual storytelling that helps you instantly understand visitor behavior.
Reactful works in a similar way to monitor your website visitor actions but takes this a step further by interpreting these in real time and personalizing their website experience accordingly. We do this by using artificial intelligence to monitor visitor actions and then use the best approach to win them over in real time. The best part is it’s a seamless experience for the user–our technology just monitors their swipes, scrolls, inactivity, and idle time, then reacts accordingly. The result is a more personalized experience for them and higher engagement and conversions for you.
Heatmap Technologies: What and Why
Let’s dive a bit deeper into how heatmaps work and the technology that powers them. Their power lies in tracking not only WHERE visitors are congregating on your website, but what they’re doing once they’re there. This allows website owners to identify trends and optimize for further engagement. The following outlines the different types of heatmaps and their applications.
Click patterns

Source: https://live.staticflickr.com/5217/5497508975_9083156954_b.jpg
One way to do this is by analyzing click patterns. A click map collects the actions taken when visitors click their mouse on desktop devices and tap their finger on mobile devices and then aggregates this data. The map shows that the more a user clicks on a certain area, the hotter (and more red) it gets in the visual data. This is helpful because it can tell you if the users are interacting with the website according to its intended priority set by the user interface developer.. If not, you will need to adjust the design accordingly.
Scroll patterns
Another thing to look at is scroll patterns. When users are scrolling through a website using either a mouse or cursor, the scroll map will show heat according to how long the cursor lingered over a certain part of the screen. Some studies have shown that there is a correlation between the cursor movement and eye gaze. So a long hover time over a specific area indicates viewer interest. This data can show hotspots on a map, such as where a viewer hovered their mouse in one area and how long they waited before they clicked the link or button.
Eye tracking patterns
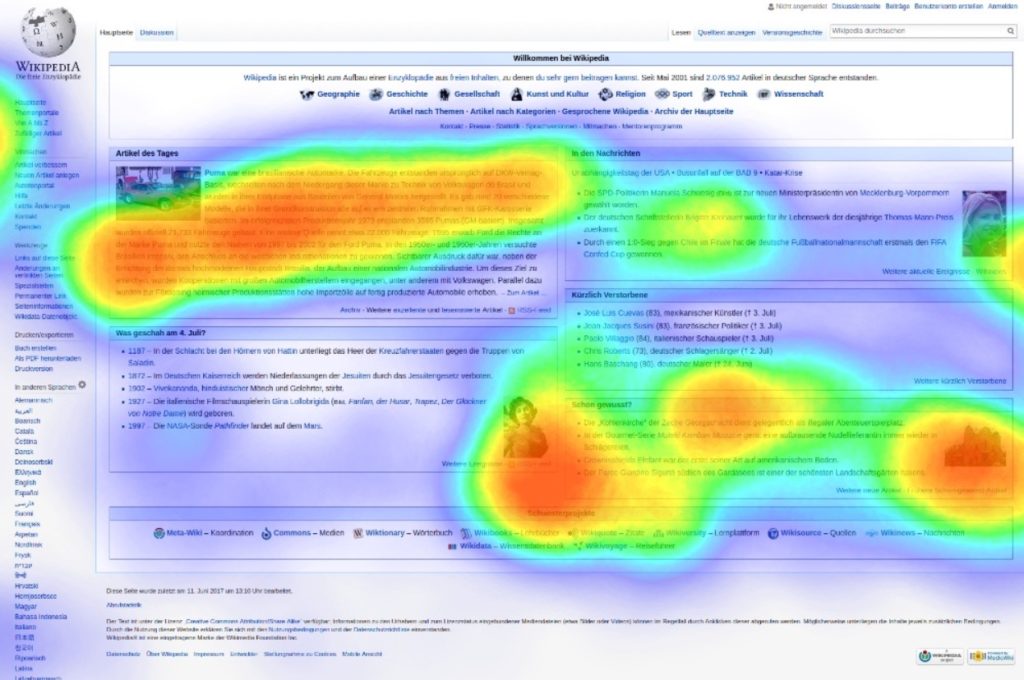
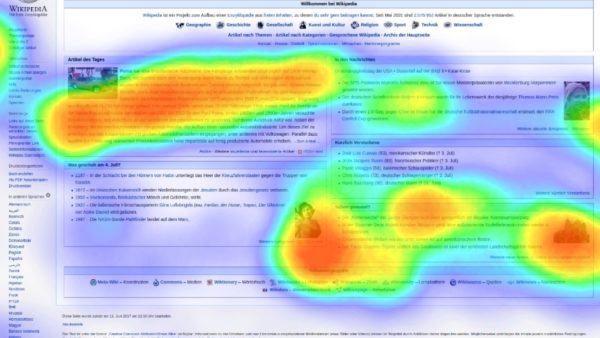
Source: https://upload.wikimedia.org/wikipedia/commons/5/50/Eyetracking_heat_map_Wikipedia.jpg
This type of heatmap tracks and records a user’s eye movements to see how they are viewing the landing page. This type of study is typically conducted in a lab with the user wearing a special eye-tracking device that can accurately measure eye movements, or via webcam.
This method is especially helpful when it comes to tracking where the eye tends to focus on the page, because it can help identify ideal placements for elements like CTA buttons and lead capture forms. Making these changes may greatly increase the possibility of a conversion.
Good areas to focus on when analyzing both types of patterns are buttons, dropdown menus, images, links, videos, and reading patterns with text.
Leading Technologies
There are a few heatmap software tools that are very popular and offer different features than most, including Crazy Egg, Mouseflow and Hotjar.
Crazy Egg offers all the heatmap types users are looking for: click heatmaps, mouse cursor heatmaps, and scroll heatmaps. It also has a differentiator in the form of its own proprietary type called a confetti heatmap. The confetti heatmap allows you to divide the data into traffic sources so that you can see how many website visits come from social networks, search, or other sites. Marketers love that it doesn’t limit your usage by site, which means you can use the same account on multiple websites. Their website editor allows you to make changes in response to heatmap data without having to use a developer.
Mouseflow also offers the standard heatmap types: click heatmaps, scroll heatmaps, movement heatmap, and attention heatmap. You can record user activity, look at form analytics to see why people are abandoning your forms, and even measure funnel activity.
Hotjar is popular because it bundles a powerful suite of apps with all-in-one analytics and a conversion optimization tool. They get points for their dashboard being intuitive and easy-to-use, their variety of heatmaps (click, scroll, tap, and mouse movement), and the ability to record user sessions. It also offers a variety of feedback collectors, including polls and surveys, so that you can target questions to specific visitors anywhere on your site.
Benefits of Heatmaps to Marketers
Page navigation
All marketers are concerned with the user experience on their sites and what they’re doing once they get there. Heatmaps allow them to track and analyze how visitors are navigating each page, what options they are clicking through, and what desired actions are NOT being taken. This data taken together can show marketers where users are experiencing friction that is preventing them from converting, and see which page elements are working and which aren’t.
Clickthrough options
Looking at heatmaps enables marketers to look at their landing pages through a visitor’s eyes. Based on this information, they can make necessary tweaks to increase conversions and improve post-click landing page optimization.
For example, looking at heatmaps might reveal that visitors are getting distracted by a navigation bar at the top of the landing page, which is preventing them from clicking a CTA button. Or that users were failing to fill out a form because they were getting distracted by some other element, like a “do not click here” button.
Of course, this data is only valuable if your site is getting enough traffic (like 2,000-3,000 page views per screen per device). Not doing so doesn’t guarantee that making changes on your post-click landing page will garner any results. If you are getting a good amount of data, it will be most beneficial to maximizing your conversion rate optimization and making UX decisions.
Marketing challenges arising from heatmaps
Heatmaps present plenty of challenges for marketers as well. It can convince you that the most active parts of your site are also the most valuable, which isn’t necessarily true. Sometimes heatmaps can lead marketers to make conclusions that are based on bias as a way to continue their own storytelling, regardless of whether or not it’s best for the site.
Too many competing options
A lot of questions can arise around having competing options on a page and what to do about this. Every CTA button on your site has its own conversion goal, so what happens if you have more than one on a page? Are you ensuring the success of one based on the failure of another? Is it a bad thing to give visitors too many options?
Heatmaps will tell you which CTA buttons have the most interaction, but are they the most effective? Clicks don’t tell the whole picture, unfortunately. For example, a user may click on a Sign In Now button without actually completing the sign-in process. Or they may click the same element multiple times, which could be an error OR a good thing if it means they’re adding to something new to their cart three times.
Identifying UX Problems
Heatmaps may also reveal that your UX design is problematic. They enable you to collect real-time data of their on-page experience and make changes based on this data instead of making assumptions. Are people repeatedly trying to click on something that isn’t actually clickable? Or are they constantly missing a call-to-action button because it’s not big enough or optimally placed?
The best websites take into account that every visitor may require a different user journey. In other words, there should be storytelling that takes users through different parts of the site based on their behavior. Have they already done their research by the time they get to your site and now they’re ready to buy? The “Get Started Now” button is for them. Or did they come to check out their options and get to know your product better before making a buying decision? They’ll likely go with the “Watch a demo” button–but you need to have both on your homepage and your heatmap likely won’t tell you how to differentiate between the two use cases.
Reactful provides real-time “heatmapping” with a real-time response
Reactful takes the same data that heatmaps provide as far as user behavior, where they’re clicking and hovering and where they aren’t taking action, but then reacts to that in real time. The website experience is actually changed and personalized based on user actions so there is less risk of losing visitors forever who you don’t convert in the moment.
Reactful does this with our artificial intelligence-powered tracking code that detects “digital body language” through their actions (clicks/taps and scrolls), idle time, engagement with content, and many other behaviors. This enables your site to continuously adapt to each visitor’s unique patterns via AI and machine learning.
By signing up for Reactful and installing a simple code snippet on your site, you can start engaging and guiding your website visitors based on their predicted behavior. If your visitor seems idle, hesitant, or confused, our predictive personalization algorithm will kick in and target whichever behavior is being displayed.
- Is it taking your user an average three tries to fill out a form?
Reactful can deliver a pop-up asking if they need help while you go and rework your form. - Has your visitor been idle too long and you’re afraid they’re about to bounce? Reactful can add a lightbox with a clear call-to-action.
In this way, your visitors are more clearly guided toward their intended action on any given page or with any element of your site.
If the need is to create a visitor journey, you can personalize every individual visitor experience. Here are just some of the ways Reactful can do this:
- Add subtle movement to a CTA button to grab attention (make it wiggle or shake)
- Add a spotlight to a page element by highlighting it and dimming the rest of the page
- Add more needed information without cluttering a page with a sidebar
- Add a Tool Tip to get people to click for more information
- Identify whether a visitor is new or returning and respond accordingly
Reactful is of course complementary to heatmaps and other marketing analytics tools that provide you with insights into areas requiring attention. Using the two together ensures that you are continuously identifying new opportunities to increase your conversions, while immediately responding to those opportunities. This ensures that you are always aligning marketing efforts with website goals and objectives.